Know which of your gas stations is actually making money

Power BI dashboards, AI workflow alerts and virtual CFO review — built on the store reports you already produce.

Keep using existing systemNDA signed before we see any data of yours
Watch: what you get every MondayA store, a shelf label, a short shift, and what we do about each.

A store, a shelf label, a short shift, and what we do about each.

Works with your back office
What you can see on your dashboard

Are you tired of asking these questions and finding these issues?

Each question maps to a Sales, Purchase or Inventory module, a short video, and a clear action your team can review.

01
Sales ModuleModule 01 · Sales
Module 01 · Sales

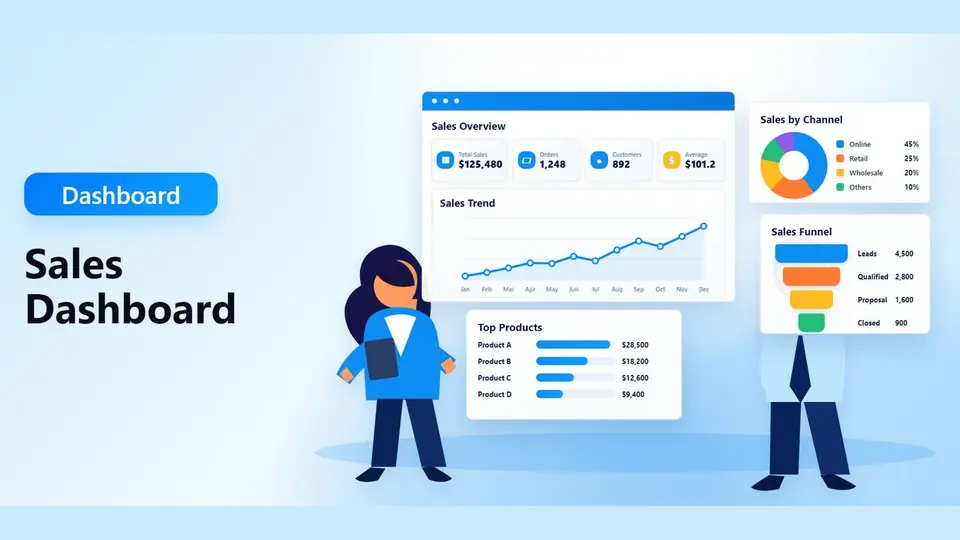
Which of my stores is actually losing money?

Fuel volume makes every store look fine. Take off wages, rent, utilities and card fees and the order changes. It is rarely the store you would have named. No back office report can show this, because payroll lives somewhere else. We join it.

What you can see on your dashboard
Store level real profitafter wages, rent, card fees
Fuel customers coming insidebaskets over forecourt visits
Same item, different pricesitems across stores
Cash and shift exceptionsshort, voids, roster
02
Purchase ModuleModule 02 · Purchase
Module 02 · Purchase

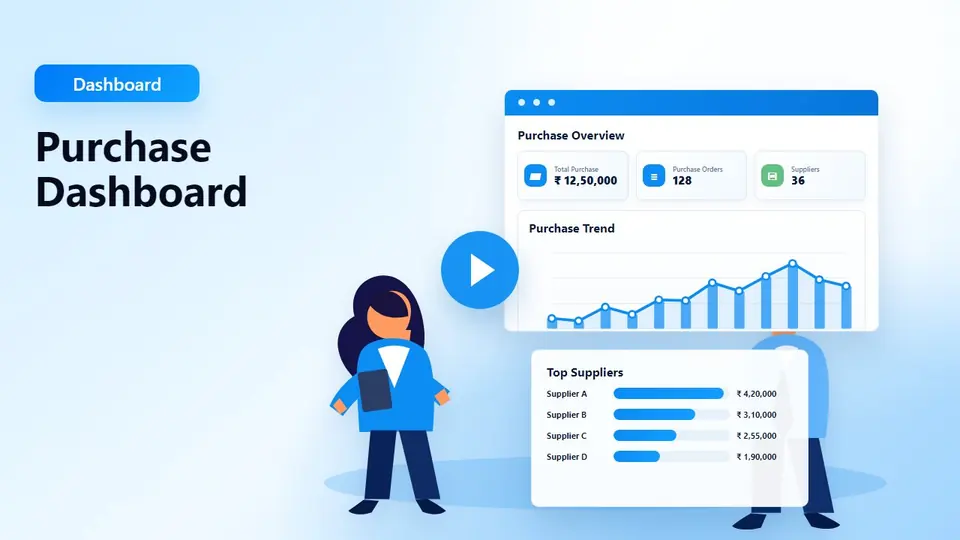
Did my cost go up without the shelf price moving?

Vendors raise cost every week. The shelf label stays the same. Hundreds of items go unrepriced for months and none of it ever shows up as a line called loss. We list every one, ranked by units sold, and draft the price file.

What you can see on your dashboard
Cost up, retail unchangeditems and dollars a month
Stop buying listdollars released
Above agreed costlines and credits owed
Fuel invoice checkslanded cost out of range
03
Inventory ModuleModule 03 · Inventory
Module 03 · Inventory

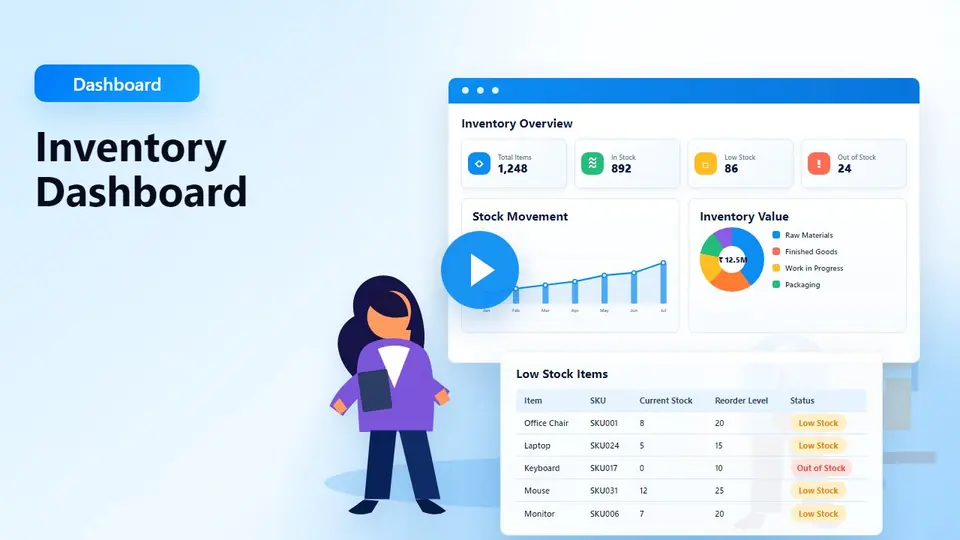
What is sitting in my stock room that never sells?

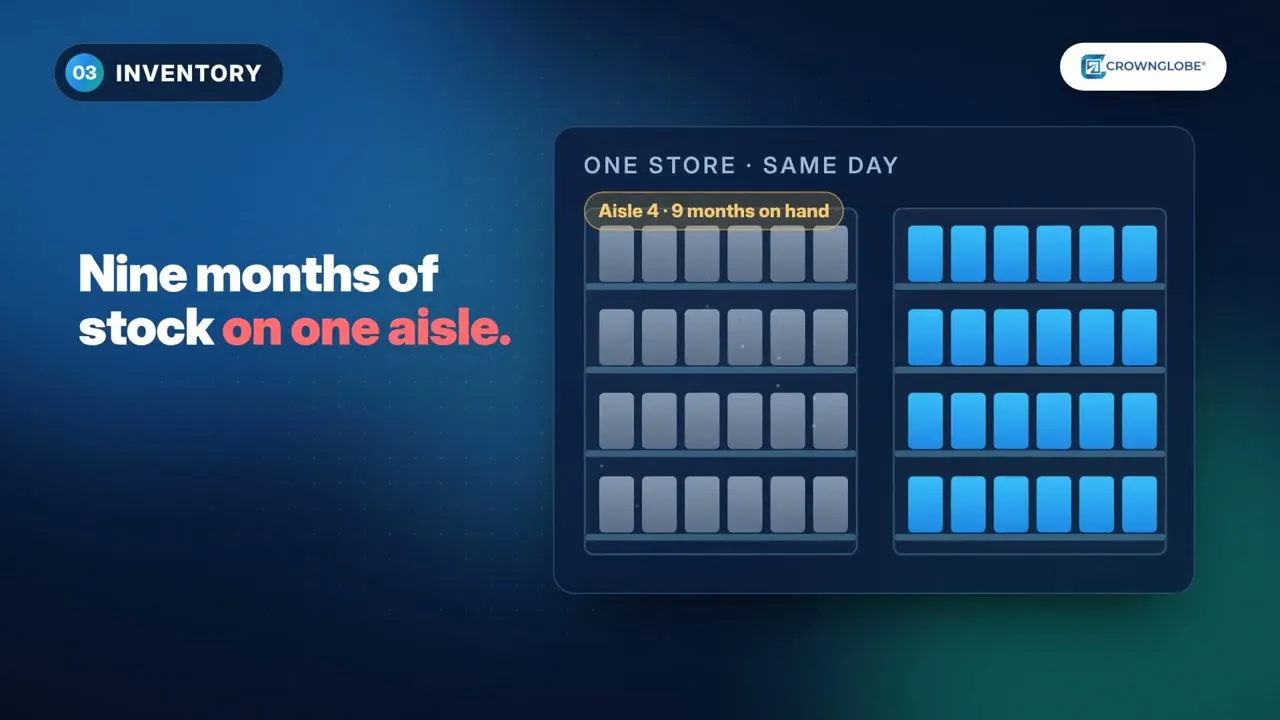
Nine months of stock on one aisle, the top sellers at zero on the next. Both are true at the same store on the same day. We separate real loss from mapping errors, free dead stock without markdowns, and catch the winners at zero.

What you can see on your dashboard
Dead stockreturn or transfer
Fast movers at zeroreorder from 4 week sales
Food waste sharepar cut, dollars a month
Fuel variancedelivery vs unexplained
The real boards

View the actual Power BI dashboards we deliver.

The live Sales, Purchase and Inventory modules run inside this demo dashboard workspace so you can understand how it will look and navigate for your stores.

Viewed best on PC / desktop.
Click an option and navigate around the interactive Power BI dashboard. Demo stores are numbered and figures are shifted.
Demo workspace. Store names and figures altered. Not any owner's records.
Your stores could be on these dashboards.We walk you through Sales, Purchase and Inventory with your own stores in mind, then load your exports if you want to go on.
begin any stores for now
Automate actions after analysis

Add custom AI agents to your dashboard.

Set rules for each agent and they finish the task accordingly. Pick your stores, choose a module, set the limit, and decide whether each agent drafts for approval or runs on its own.

Start analyzing all your stores together.Assign AI agents to automate routine management tasks after the dashboard highlights the issue.
Start analyzing my stores
About CrownGlobe

People who read store data for a living.

CrownGlobe provides accounting services and virtual CFO services for gas station and convenience store owners, backed by Power BI dashboards and AI agent workflows. From our New Jersey office, a named analyst reads your numbers with you every week.

Testimonials

Owners who finally know which store makes money.

What operators say once their stores are on the boards, in their own words.

I used to spend every Monday morning opening report after report and still walk into the week guessing. Now the same numbers are on one board, the agents flag the stores that cross a limit, and the price file for every cost increase is already drafted for me to approve. My reporting time went from four hours to twenty minutes and the stores actually get fixed.

Director of Operations12 site operator · Texas

Hear it from a CrownGlobe client.

I run nineteen stores across two states and for years I could not tell you which one was actually making money. The dashboards put payroll and card fees next to sales, store by store, and one location I thought was my best turned out to be the one costing me. We fixed the schedule there in a week. I should have had this three years ago.

Onboarding

We learn how your stores run before we build anything.

There is no plan to pick off a page. We start with a conversation, review your portals and your data, and then show you exactly how we would work with your stores. At our New Jersey headquarters, our global team is available to support your stores.

Week 1Discovery call

You tell us how many stores you run, which back office you use, what reports you read today and what you wish you had.

Week 1Confidentiality and access

Written terms first. Then read only access to your portals, or the exports you can already run. Nothing is installed and nothing is replaced.

Weeks 2 to 4Review of your portals and data

We go through your reporting style, your store setup and your data quality, and work out how to cater to your stores.

Week 4 to 5Your proposal

What we will build, what it costs per store, and which custom AI agents make sense for you. One page. Nothing hidden.

2 to 3 weeks after you accept the proposalOnboarding

We connect your data, build the dashboards around your stores, and go live. Your named analyst walks your team through them and shares the first analysis.

Start with the conversation.Thirty minutes, your stores, your questions. We will tell you honestly whether we are the right fit before anything else happens.
Book the discovery call
Pricing

You can start small, yet see the smartest decisions for each of your stores.

One clear per store price, no per seat charge. Your final price is confirmed in your proposal once we have reviewed your stores.

Dashboard plan
Sales, Purchase and Inventory dashboards, with your analyst
$350per store, per month
Starting from. Confirmed in your proposal after we review your stores.
  • Sales, Purchase and Inventory dashboards in Power BI, store level and group level
  • Analysis of what changed across your stores, with the actions to take highlighted
  • Payroll and card fees joined, so you see real profit by store
  • A named analyst who knows your stores and your reporting style
  • A monthly summary for your bank or your partners
Book the discovery call

Custom AI agents

Added on top of the dashboard plan
  • Agents that act on the limits you set on your dashboards
  • Scoped to the stores and the rules you switch on
  • The control panel: you decide what drafts for you and what runs on its own
Talk through the AI agents

What every engagement includes

Whatever the size of your group
  • Written confidentiality before we see a row
  • Your current back office stays exactly as it is
  • Priced per store, billed monthly, no long contract to start
Free resources

Take these. Free resources built for you.

Three checklists our analysts use when they review store data.

The Weekly Leak Checklist

Six pages. The 30 checks we run on every owner's reports each week, with the limit for each.

Download the PDF
The Month End Close Checklist

Six pages. What to reconcile before you believe the P&L, in order.

Download the PDF
The Monday Analysis Checklist

One page. Five decisions to check after Sales, Purchase and Inventory are reviewed.

Read the checklist
Questions owners ask us

Straight answers.

What is a Power BI dashboard?
It is an interactive dashboard that turns your Sales, Purchase and Inventory reports into charts, filters and store-level views. You can click through stores, dates, categories and problem lines instead of reading static reports.
How will CrownGlobe help me?
We connect the reports you already export, build the dashboards, review the numbers, and show the decisions hiding inside them. The goal is not another report; it is a clearer action for each store.
Will the dashboard get integrated with my existing software?
Yes. We work around your existing back office and accounting setup. Petrosoft, Gilbarco Passport, Verifone Commander, NCR, Modisoft, QuickBooks or another system can stay in place.
How safe is my data?
Your data is handled under an NDA before we see a row. We set up the workspace for your engagement, use only what is needed for the dashboard, and do not publish, benchmark or reuse it without your approval.
What if my data is messy?
That is normal. Unit errors, missing recipes, negative counts and inconsistent item names are common. We flag those issues so the dashboard explains the problem instead of hiding it.
What do I get in the dashboard?
You get three owner-friendly sections: Sales, Purchase and Inventory. Each section includes KPIs, store views, group views, key exceptions, and the lines that need attention first.
How will CrownGlobe's Power BI dashboard help my gas stations and stores?
The dashboard is built as three sections, so you read one part of the business at a time and then compare all of it across stores.
SalesReal profit per store once wages, rent and card fees come off. Inside sales measured against fuel volume, margin by category, and the counters or shifts that behave differently from the rest.
PurchaseWhere cost went up without the shelf price moving, invoices billed above the agreed rate, and the orders worth holding this week because cover is already there.
InventoryDead stock sitting on the shelf, fast movers at zero, near-expiry lines, and the counts, shrink and waste that do not tie back to the system.
Each section ends in the same place: which stores need attention first, and what to do about it this week.
What decisions can I take from the dashboard?
You can make decisions by looking at the important KPIs across all three modules: Sales, Purchase and Inventory. It helps you see what needs attention first and where action is required.
Is this data loaded in real time?
No. The data refreshes on your reporting cycle, usually weekly or monthly, depending on how often your reports are shared.
On what devices can we access the dashboards?
You can access the dashboards from desktop, laptop, tablet and phone. The full Power BI experience is best on a PC or desktop screen.
What is the cost of this dashboard?
The dashboard cost is $350 per month per store.
Will I have to pay for every team member?
No. Pricing is based on stores and engagement scope, not on every team member who needs to see the dashboard.
Do you have a free trial?
No. We can schedule a Zoom demo call and give you a clear understanding of our product before you decide.
Book a Demo

Thirty minutes. Your stores, on the boards.

  • No system change. Your current setup stays exactly as it is.
  • Demo first. The conversation shows how your store data can appear on the boards before you decide next steps.
  • NDA first. Written terms signed before we see a single row.
  • Your questions first. Bring the store that worries you. We show you how it would appear on the boards.